상단 정보영역
Financial Highlights
The following graph shows the status of LG U+'s total assets, liabilities, and equity by year.
Summarized Statement of Financial Position(Consolidated)
Update on 2023
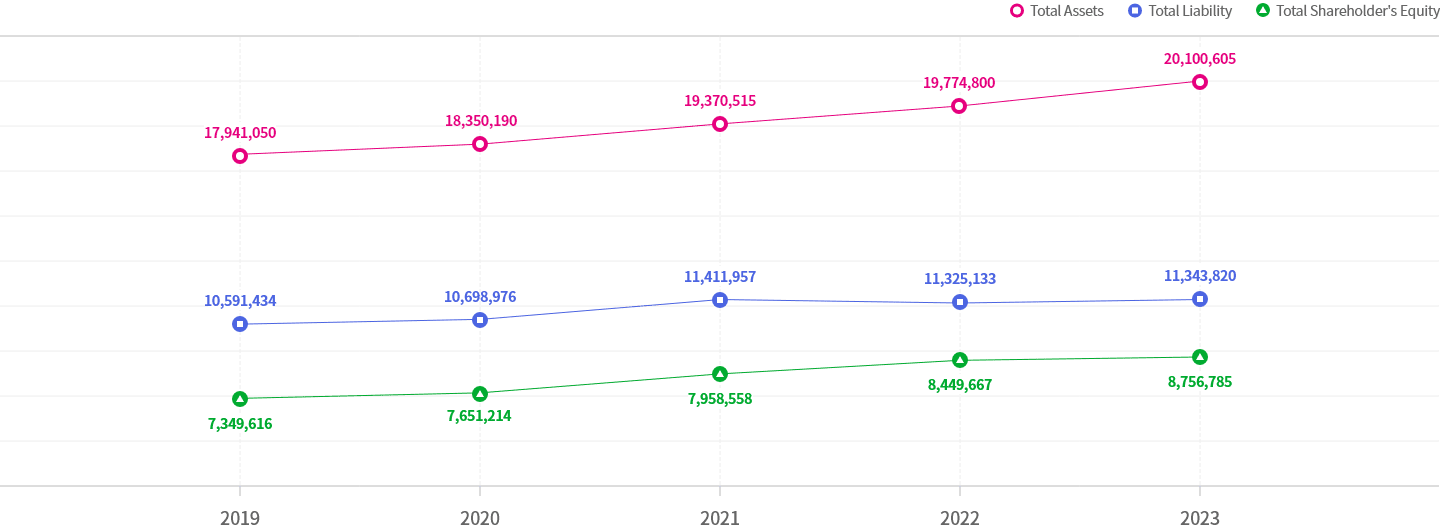
- Unit : KRW in millions
| Classification | 2019 | 2020 | 2021 | 2022 | 2023 |
|---|---|---|---|---|---|
| Total Assets | 17,941,050 | 18,350,190 | 19,370,515 | 19,774,800 | 20,100,605 |
| Current Assets | 4,805,494 | 4,950,900 | 5,164,421 | 5,043,422 | 4,964,158 |
| Non-current Assets | 13,135,556 | 13,399,290 | 14,206,094 | 14,731,378 | 15,136,447 |
| Total Liabilities | 10,591,434 | 10,698,976 | 11,411,957 | 11,325,133 | 11,343,820 |
| Current Liabilities | 4,648,853 | 4,328,335 | 5,073,659 | 4,817,824 | 5,606,861 |
| Non-current Liabilities | 5,942,581 | 6,370,641 | 6,338,298 | 6,507,309 | 5,736,959 |
| Total Shareholders' Equity | 7,349,616 | 7,651,214 | 7,958,558 | 8,449,667 | 8,756,785 |
| Capital Stock | 2,573,969 | 2,573,969 | 2,573,969 | 2,573,969 | 2,573,969 |
| Capital Surplus | 836,918 | 836,918 | 836,918 | 836,918 | 836,918 |
| Retained earnings | 3,673,570 | 3,968,550 | 4,364,076 | 4,866,522 | 5,167,580 |
|
Accumulated Other Comprehensive Income | -3,596 | -4,575 | -1,819 | -12,274 | -6,265 |
| Other Shareholders' Equity | - | - | -100,000 | -100,000 | -100,000 |
| Non-controlling Interest | 268,755 | 276,352 | 285,414 | 284,532 | 284,583 |
| Debt Ratio | 144% | 140% | 143% | 134% | 130% |
- Unit : KRW in millions
Summarized Statements of Income(Consolidated)
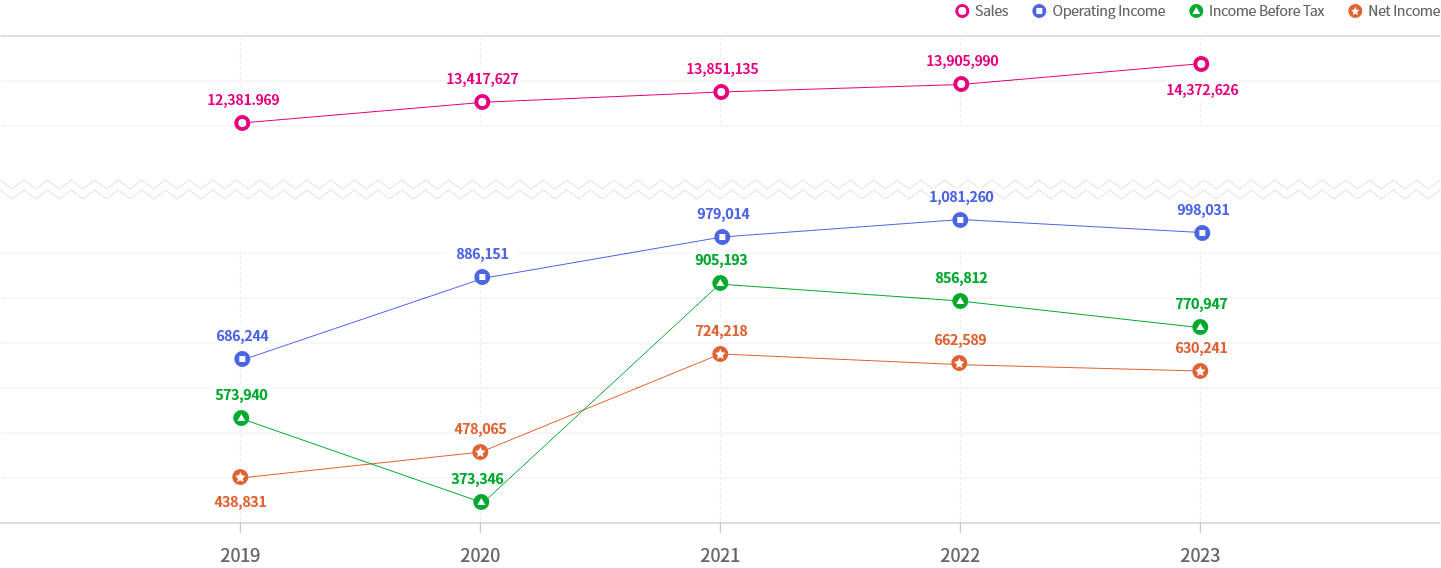
- Unit : KRW in millions
| Classification | 2019 | 2020 | 2021 | 2022 | 2023 |
|---|---|---|---|---|---|
| Sales | 12,381,969 | 13,417,627 | 13,851,135 | 13,905,990 | 14,372,626 |
| Operating Income | 686,244 | 886,151 | 979,014 | 1,081,260 | 998,031 |
| Income Before Tax | 573,940 | 373,346 | 905,193 | 856,812 | 770,947 |
| Net Income | 438,831 | 478,065 | 724,218 | 662,589 | 630,241 |
- Unit : KRW in millions